【Rで自然言語処理】自然言語処理から見る米国映画の変遷 その弐
前回、米国映画のあらすじを用い、トピックモデルによって分析する、という実験を行いました。今回はそれに続いて、センチメント分析を行い、トピックモデルの結果との結合を試みました。
センチメント分析の概略
トピックモデルにおいてはLDAという、確率分布を用いた手法をとりましたが、今回用いたセンチメント分析はごくごく単純に感情語辞書を用い、あらすじにどれだけその感情語が含まれているか、という分析を行っています。
やっていることは極めて単純ですが、感情語の集計にdplyrを使ってコーディングが簡単になるようにしてみました。
また、感情語辞書を使うにあたって、"tidytext"パッケージを利用しますので、入っていない方はインストールしておいてください。
センチメント分析用のデータ作成
前処理
まずはテキストの前処理を行います。前回までのコードをすべて実行したものとして話を進めます。
preText2 <- tolower(allTexts)
preText2 <- tm::removePunctuation(preText2)
preText2 <- tm::removeWords(preText2,sw)
preText2 <- tm::removeNumbers(preText2)
前回トピックモデルに使ったテキストデータは前処理の段階でステミングをしていましたが、今回はステミングはしません。というのも、使用する感情語辞書が活用形を考慮したものだからです。
sentimentData <- get_sentiments(lexicon = c("nrc"))tidytextの感情語辞書をsentimentDataに入れます。使用する感情語辞書は"nrc"を使っています。他の辞書はpositive,netagiveの分類しか入っていなかったため、nrcにしました。
さて、このsentimentDataの中身をのぞいてみると、
> head(sentimentData,20)
# A tibble: 20 x 2
   word        sentiment
   <chr>       <chr>
 1 abacus      trust
 2 abandon     fear
 3 abandon     negative
 4 abandon     sadness
 5 abandoned   anger
 6 abandoned   fear
 7 abandoned   negative
 8 abandoned   sadness
 9 abandonment anger
10 abandonment fear
11 abandonment negative
12 abandonment sadness
13 abandonment surprise
14 abba        positive
15 abbot       trust
16 abduction   fear
17 abduction   negative
18 abduction   sadness
19 abduction   surprise
20 aberrant    negative
となっているように、"abandon"と"abandoned"は別扱いとなっています。活用形を加味した感情語辞書となっているため、元テキストのステミングは不要なのです。
続いて全テキストを処理していきます。
fullSummary <- lapply(preText2,function(x){
  out <- strsplit(x,split="[[:space:]]+")
  out <- as.data.frame(table(out))
  names(out) <- c("word","count")
  out <- inner_join(out,sentimentData)
  return(out)
})
各テキストの出現単語をカウントし、それにdpylyのinner_joinで感情語辞書を引っ付けます。すると、
head(fullSummary[[1]],20)
           word count sentiment
1       ancient     1  negative
2        attack     1     anger
3        attack     1      fear
4        attack     1  negative
5     attacking     1     anger
6     attacking     1   disgust
7     attacking     1      fear
8     attacking     1  negative
9     attacking     1   sadness
10    attacking     1  surprise
11    authority     1  positive
12    authority     1     trust
13        blame     1     anger
14        blame     1   disgust
15        blame     1  negative
16 civilization     1  positive
17 civilization     1     trust
18  complicated     1  negative
19         crew     1     trust
20        death     1     anger
というように単語、カウント数、感情、というデータフレームが作られます。これをもとに、各テキストの感情の分布を集計していきます。
ちなみに、ncrに含まれている感情分類は"anger", "anticipation", "disgust", "fear", "joy", "negative", "positive", "sadness", "surprise", "trust"の10種類です。
感情語分布の集計
sentimentCount <- lapply(fullSummary,function(x){
  out <- group_by(x,sentiment) %>%
         summarise(sum=sum(count))%>%
         ungroup()
  len <- sum(out$sum)
  out$ratio <- out$sum / len
  outnames <- out$sentiment
  out <- out$ratio
  names(out) <- outnames
  return(out)
})
はい、ここでdplyrの登場です。group_byとsummariseを使います。
dplyrを使わない場合、各factor毎に分けて合計したり、とかしなきゃいけないところですが、group_byでfactorでグループ化し、それをそのままsummariseにもっていくとグループごとにsummariseで指定した集計をしてくれます。これまであまり注目していなかったのですが、今回のような集計をするにあたってはコードが単純になって非常にいいです。
で、各テキスト毎に単語数が違うので出現頻度から出現割合に直して出力、という形にしています。
で、最後にひとつにまとめてデータフレームの形にすればOKです。
sentimentCountDF <- do.call(bind_rows,sentimentCount)
sentimentCountDF[is.na(sentimentCountDF)] <- 0
dataDFsentiment <- data.frame(dataDFreduce[,1:3],sentimentCountDF)
colnames(dataDFsentiment)[c(2,3)] <- c("dataDFreduce.TITLE","dataDFreduce.YEAR")

# bind sentiment and cluster assign
clusterDFsentiment <- inner_join(topicProbabilityAssign,dataDFsentiment)後々の集計のため、トピックモデルにおけるクラスタリングの結果を格納したデータフレームにinner_joinして、分析に使うデータの作成は完了です。
センチメントの時系列変化
全体的な傾向の確認
まず、全体的な傾向として、感情語分布のbox-plotを描いてみます。
boxplot(dataDFsentiment[,4:13])

"disgust", "sadness", "surprise"あたりはややすくない傾向にありそうですが、ばらつきが大きすぎてはっきりした傾向がつかめません。
そこでまず、各センチメントが時系列にどのように変化してきたかをみてみます。
sentimentFullmed <- clusterDFsentiment %>%
  group_by(dataDFreduce.YEAR) %>%
  summarise(medianAnger=median(anger),
            medianAnticipation=median(anticipation),
            medianDisgust=median(disgust),
            medianFear=median(fear),
            medianJoy=median(joy),
            medianNegative=median(negative),
            medianPositive=median(positive),
            medianSadness=median(sadness),
            medianSuprise=median(surprise),
            medianTrust=median(trust))
sentimentFullmed <- sentimentFullmed[order(as.numeric(as.character(sentimentFullmed$dataDFreduce.YEAR))),]
box-plotでみたように、ばらつきが非常に大きく、かつ分布も偏っているようですので、ここでは代表値としてmedianをとることにしました。ここでもdplyrのgroup_byとsummariseが活躍しています。
で、このデータをmatplotで描画してみると、
matplot(sentimentFullmed$dataDFreduce.YEAR,
        sentimentFullmed[,2:11],
        col=seq(10),
        pch=1,
        type="o",
        lty=c(rep(1,8),rep(2,2)))
par(xpd=T)
legend(par()$usr[2]-40, par()$usr[4]+0.03,
       ncol=5,
       cex=0.7,
       legend=colnames(sentimentFullmed[,2:11]),
       col=seq(10),
       pch=1,
       lty=c(rep(1,8),rep(2,2)))
lines(seq(from=1970,to=2015), rep(0.05,46), col="gray",lty = 2)
lines(seq(from=1970,to=2015), rep(0.1,46), col="gray",lty = 2)
lines(seq(from=1970,to=2015), rep(0.15,46), col="gray",lty = 2)
lines(seq(from=1970,to=2015), rep(0.2,46), col="gray",lty = 2)
lines(seq(from=1970,to=2015), rep(0.25,46), col="gray",lty = 2)
こうなりました。
2016年でおかしなプロットになっているのはサンプル数が極端に少ないからです。そこは無視してみてみましょう。
まず、大きな傾向として黄色で示した"positive"とピンクで示した"negative"に着目します。傾向としてはかなり微妙ですが、"positive"がやや増加傾向にあり、"negative"が減少傾向にあるように見えます。1990年くらいまではかなり接近している"positive"と"negative"ですが、その間が広がってきているように見えます。
それ以外はほぼ横ばいといえそうですが、緑の"disgust"についてはやや減少傾向にあるようにも見えます。
トピックモデルの結果との組み合わせ
では、トピックモデルでクラスタリングした結果と組み合わせてみたらどうでしょうか。
sentimentSplit <- split(clusterDFsentiment,as.factor(clusterDFsentiment$clustAssign))
sentimentTimeSeries <- lapply(sentimentSplit,function(x){
  out <- x %>%
    group_by(dataDFreduce.YEAR) %>%
    summarise(medianAnger=median(anger),
              medianAnticipation=median(anticipation),
              medianDisgust=median(disgust),
              medianFear=median(fear),
              medianJoy=median(joy),
              medianNegative=median(negative),
              medianPositive=median(positive),
              medianSadness=median(sadness),
              medianSuprise=median(surprise),
              medianTrust=median(trust))
  out <- out[order(as.numeric(as.character(out$dataDFreduce.YEAR))),]
  return(out)
})まずセンチメントデータを含んだデータフレームをトピックモデルの各クラスタ毎にsplitします。その上で、上でやったようにgroup_byとsummariseで各センチメント毎のmedianを計算します。で、matplotで描画。
# time series plot
plotCluster <- 1
matplot(sentimentTimeSeries[[plotCluster]]$dataDFreduce.YEAR,
        sentimentTimeSeries[[plotCluster]][,2:11],
        col=seq(10),
        pch=1,
        type="o",
        lty=c(rep(1,8),rep(2,2)),
        ylim=c(0,0.3))
par(xpd=T)
legend(par()$usr[2]-40, par()$usr[4]+0.03,
       ncol=5,
       cex=0.7,
       legend=colnames(sentimentTimeSeries[[plotCluster]][,2:11]),
       col=seq(10),
       pch=1,
       lty=c(rep(1,8),rep(2,2)))
lines(seq(from=1970,to=2015), rep(0.05,46), col="gray",lty = 2)
lines(seq(from=1970,to=2015), rep(0.1,46), col="gray",lty = 2)
lines(seq(from=1970,to=2015), rep(0.15,46), col="gray",lty = 2)
lines(seq(from=1970,to=2015), rep(0.2,46), col="gray",lty = 2)
lines(seq(from=1970,to=2015), rep(0.25,46), col="gray",lty = 2)
これはcluster=1を描画するコードです。いちいち読み込むリストの位置を変えるのが面倒なのでplotClusterという変数に値をいれて描画するようにしています。

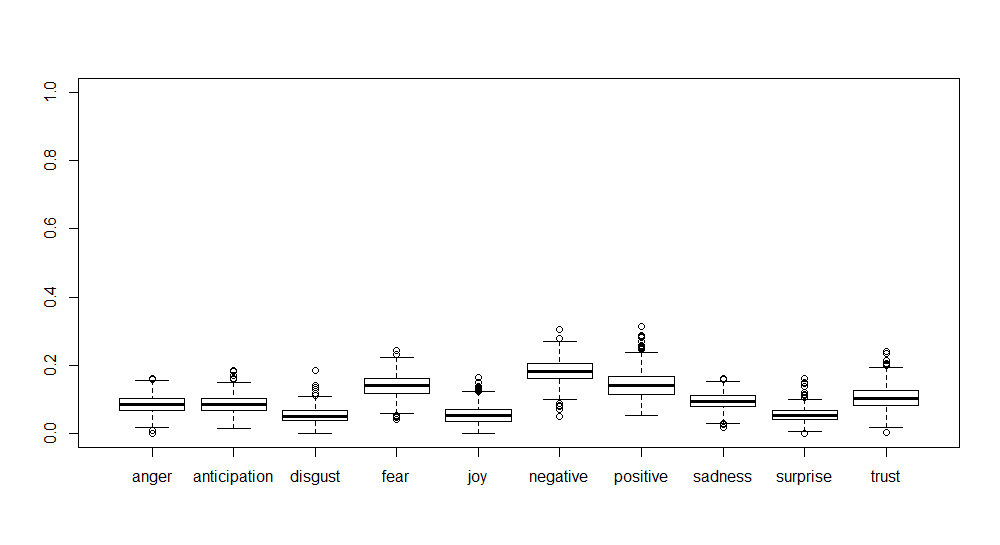
cluster1は戦争映画だったのでした。戦争映画はそもそも制作数が相対的に減少してきているので傾向がはっきりしません。box-plotでみると、

まず"positive", "negative"が拮抗しており、次いで"fear"が高く出ています。加えて"trust"が出ており、ポジティブなものもネガティブなものも作られているようです。
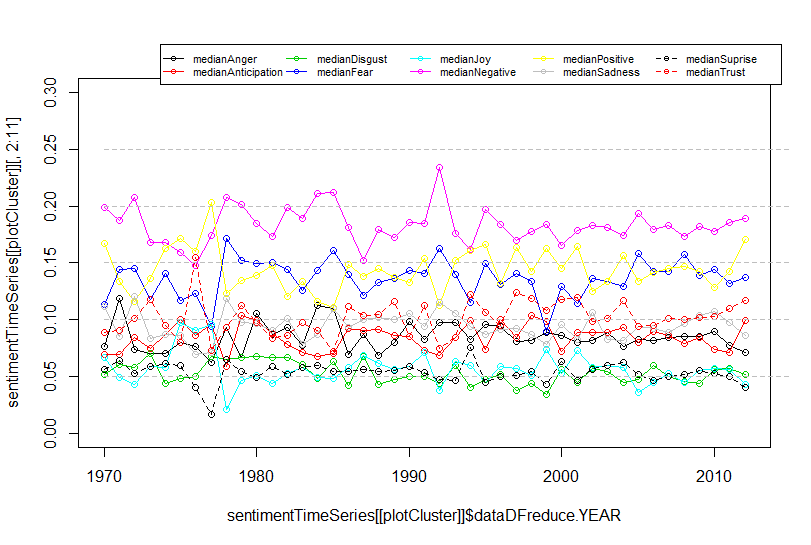
政治・社会系だったcluster5はどうでしょうか。

"positive"がやや増加傾向にあるようです。赤の破線の"trust"は1970年代半ばに大幅に低下、1980年代後半に大幅に上昇、その後安定、という推移をたどっているように見えます。box-plotで見ると

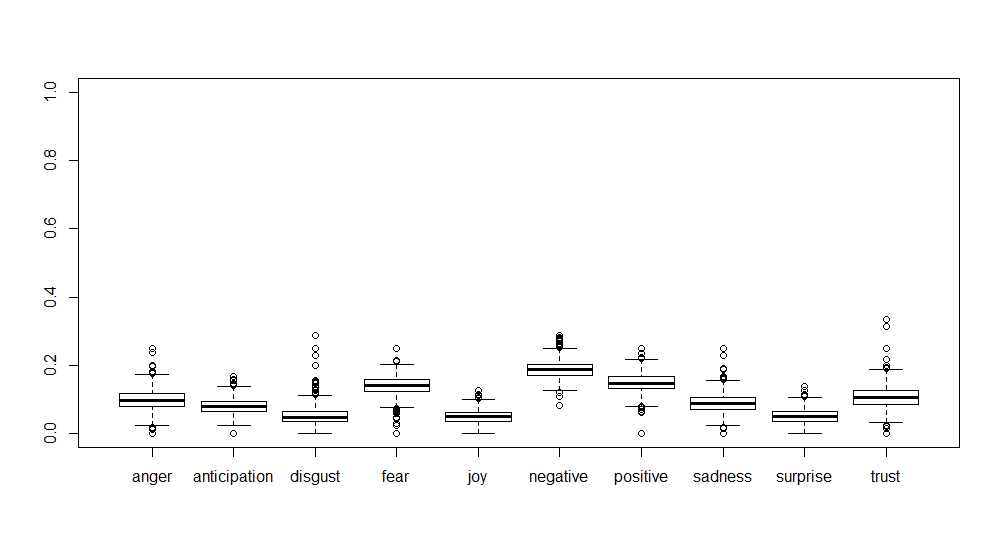
"positive", "negative", "trust"あたりが高く、とはいえばらつきが多きいようです。時期による変動も大きく、やはり政治・社会ものの映画はそのときの社会状況を反映するものなのでしょうか。
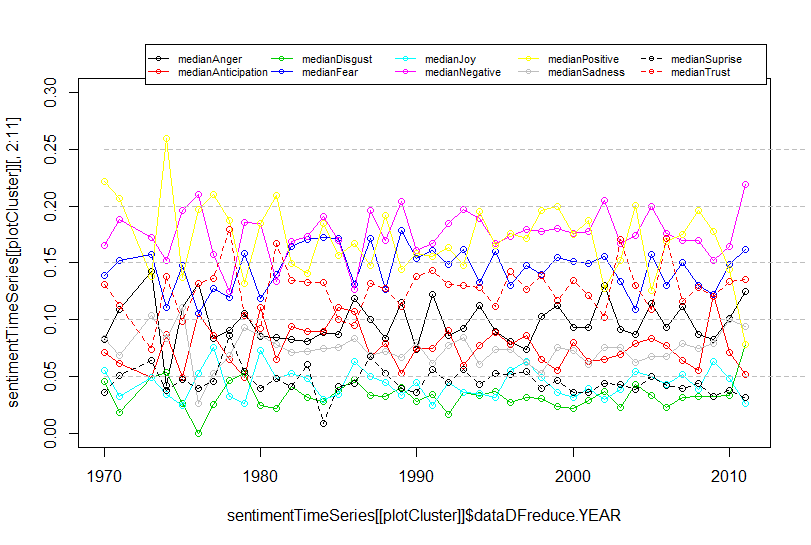
最後にスプラッターもののcluster7を見てみましょう。

う~ん、傾向があるようなないような、というところですかね。

"negative"と"fear"が高くでるのはスプラッターホラーとしては当然の結果でしょう。"positive"も割と出ているようで、これはいったい何を示唆してるのか、なんだかはっきりしません。
センチメント分布のクラスタリング
今回の分析の最後として、センチメント分布をクラスタリングし、トピックモデルの結果とくっつけてみます。それにあたって、トピックモデルのクラスタリングではっきり分類できなかったcluster2はのぞいてみました。
# sentiment clustering
hierSentiment <- fastcluster::hclust.vector(clusterDFsentiment[clusterDFsentiment$clustAssign!=2,25:34],method = "ward")
clustSentimentAssign <- cutree(hierSentiment,k=10)
sentimentAssign <- cbind(clusterDFsentiment[clusterDFsentiment$clustAssign!=2,],clustSentimentAssign)
これで、トピックモデルにおけるcluster2をのぞいたデータでセンチメント分布によるクラスタリングができました。
table(sentimentAssign$clustAssign,sentimentAssign$clustSentimentAssign)

       1   2   3   4   5   6   7   8   9  10
  1   16  30  18  19   4  65   0  30   0   0
  3   89  59  56 128  16 153  14 150   7   0
  4   80  32   9 117   5 100  11  36   2   1
  5  110  55  29  70  32  73  24  49   9   2
  6    8  50  22  43   4 122   1  86   0   0
  7   24  32  10  65   2 182   0 105   0   0
  8   92  56   2  28  13  32  22   2   4   0
  9   66  20  30  80   2  80   4  29   2   0
10 33 10 21 41 0 59 0 13 0 0縦がトピックモデルによるクラスタリング、横がセンチメント分布によるクラスタリングの結果です。でも、数値だけ眺めていても傾向がはっきりしないので、これも図にしてみましょう。
plot(table(sentimentAssign$clustAssign,sentimentAssign$clustSentimentAssign)/rowSums(table(sentimentAssign$clustAssign,sentimentAssign$clustSentimentAssign)))
とすると、こんな絵が描けるのです。今回やってみるまで知りませんでした。

見方の注意としてはtableで出した結果と違って縦がセンチメント、横がトピックモデルになっているところです。
まずトピックモデルのcluster1(戦争映画)をみると、センチメントのcluster6が大きな割合を占めています。他にセンチメントのcluster6が大きいのを探してみると、トピックモデルのcluster6、cluster7あたりが大きくなっています。それぞれSFホラー・サスペンスっぽいのとスプラッターホラーでした。では、センチメントのcluster6をbox-plotしてみましょう。

このように"negative"と"fear"が高く出てきています。
また、トピックモデルのcluster8(スポーツ物)は他のクラスタとセンチメントの出方が違うようですが、センチメントで大きな割合を占めているcluster1を出してみると、

"positive", "anticipation", "trust"が高く出ており、いかにもスポーツものっぽい結果となりました。
ここまでやると、なんとなくそれっぽい結果が見えてきて面白い感じですね。
あとは可視化の部分がもっとわかりやすくなると良いなぁ、と思いつつ、今回はこれにて終了としたいと思います。
今回、前回とも、グラフは一部しか出力していません。全体のデータを見てみたい方は全コードを実行した後、ご自身で作図してみてください。
まとめ
というわけで、2回にわたって米国映画のあらすじを使っていくつかの側面から分析してみました。なんとなくそれっぽい結果が見えてきて、なかなかいい感じなのじゃないかと思っています。
さらにやるとすれば、
- レビューテキストとの結合
- 収益との関係
- トピックの類似性による関連性ネットワークの作成
あたりをトピックモデルと機械学習あたりを組み合わせてやってみると面白いかもしれません。
後は可視化まわりをshiny+D3.jsでごりごりやるとか。
※shiny+D3.jsはいずれやりたいです。